A Chart's Tale - How to trade zones
Part of our Chart Analysis series
“So, how do you trade a zone?”
Hey folks!
Welcome to our short series of educational deep dives into the art of trading zones.
In this first installment, we’ll break down how zones are born, how to read price action around them, as well as how to manage risk around key support and resistance zones—all with real-world chart movements.
Before we begin, let’s cover the basics
A Zone is a range of prices that our algorithm assigns to the same area of support or resistance.
The charts we’ll be using today were taken from the Trading Places platform—which you could soon have access to once we launch in beta.
Moreover, all of the zones you’ll see on the charts were automatically detected and plotted by our proprietary Zone Detection Algorithm, which scans the entire market (and soon, including crypto and currencies) to identify stocks approaching key zones.
For the matter of this discussion, we’ll be analyzing the MSFT chart generated at the time of writing. But you’ll see that the same reasoning and “chart analysis” we’ll cover today can apply to most setups.
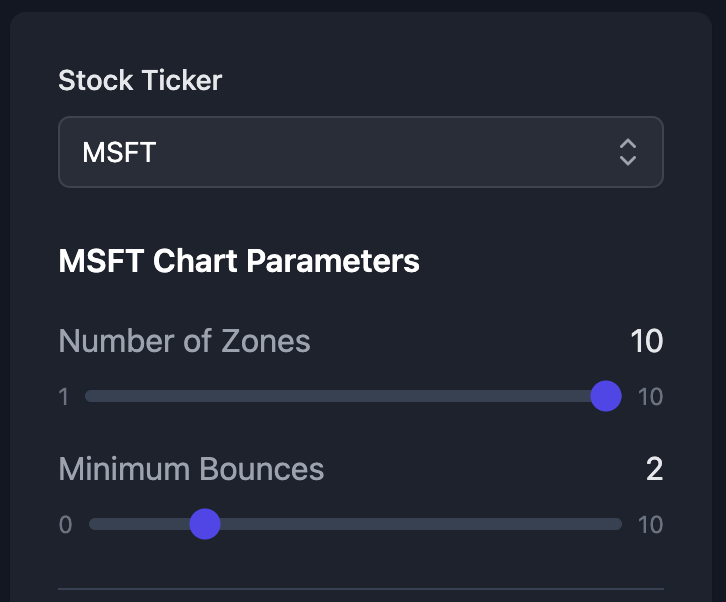
We’ve also filtered the chart to only show zones with at least two active bounces (Fig.1).
For context, an Active Bounce is a stock’s retest and subsequent bounce out of a zone, while a Penetration is just the opposite—a zone break.
The penetration of a resistance zone, for example, absorbs all of the supply at that particular price level. This means there aren’t (at least for now) any more sell orders there.
Using zones with at least one active bounce helps in decluttering the chart and focusing on what’s more likely to be important.
Let’s get started.
As our backtests (and perhaps your own empirical experience) can confirm—when zones/supports/resistances are broken, they are often retested first before trend can resume.
Let’s look at an example so we can understand why this happens and why it’s important.
Resistance zones becoming support
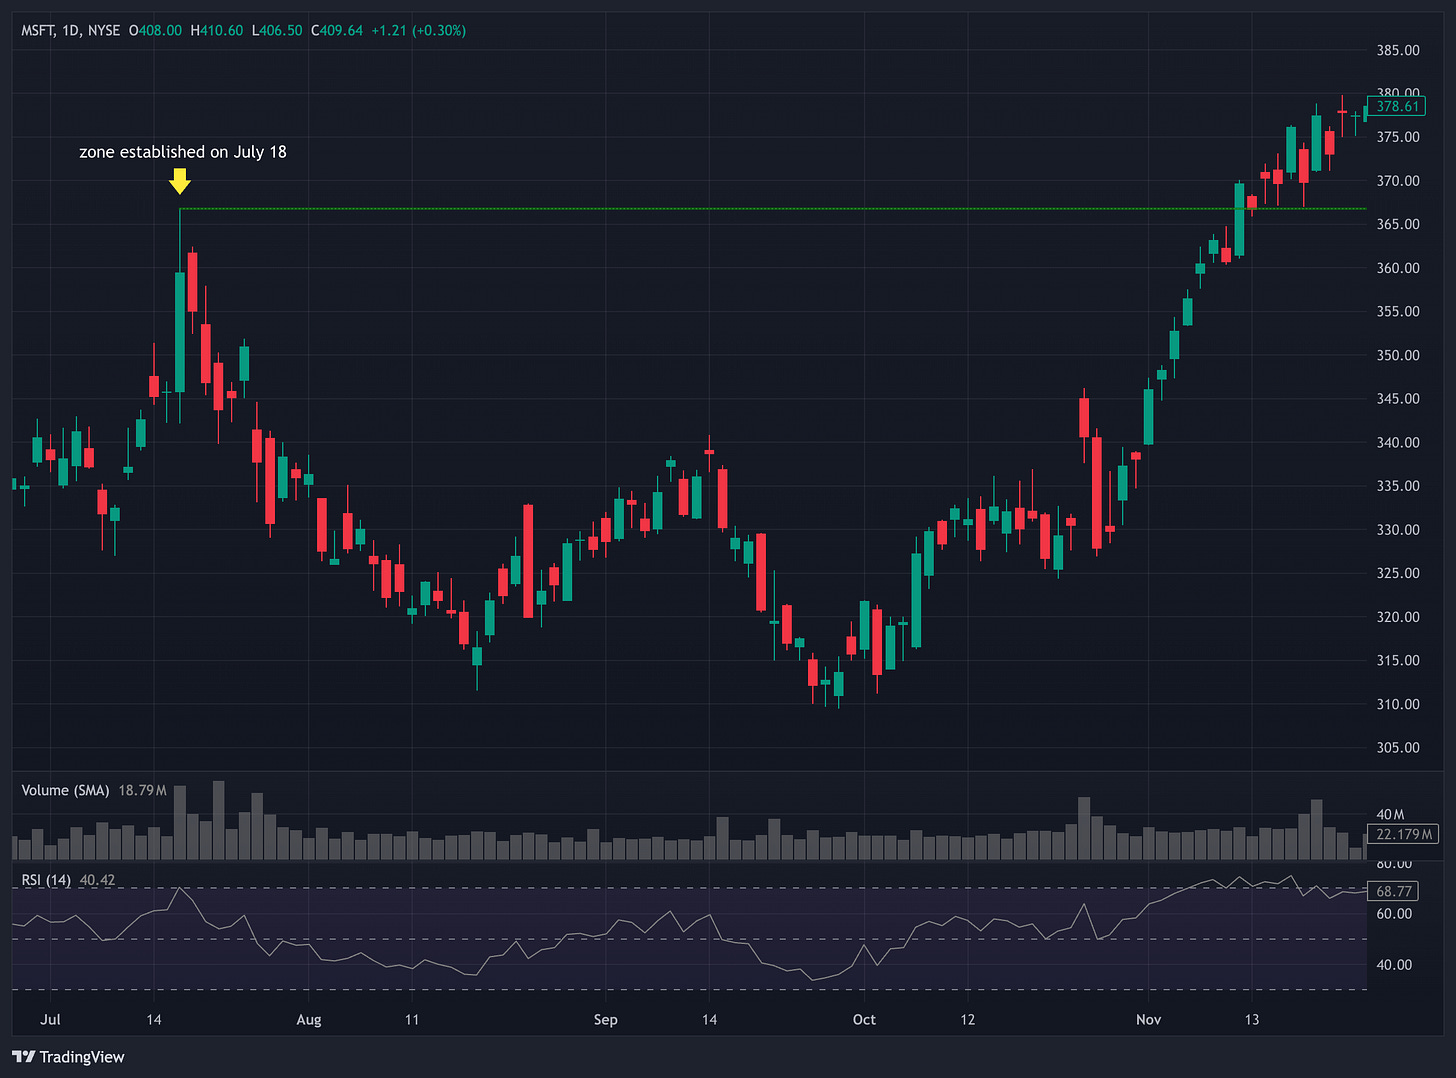
Let’s take a closer look at MSFT’s July 18, 2023 zone, at $366 (Fig.3).
This zone was brought forth by a sharp reversal on July 18, 2023—an all-time high at that time.
MSFT traded below this zone for months, before finally managing to penetrate (or break out, in case you forgot) on November 10, 2023.
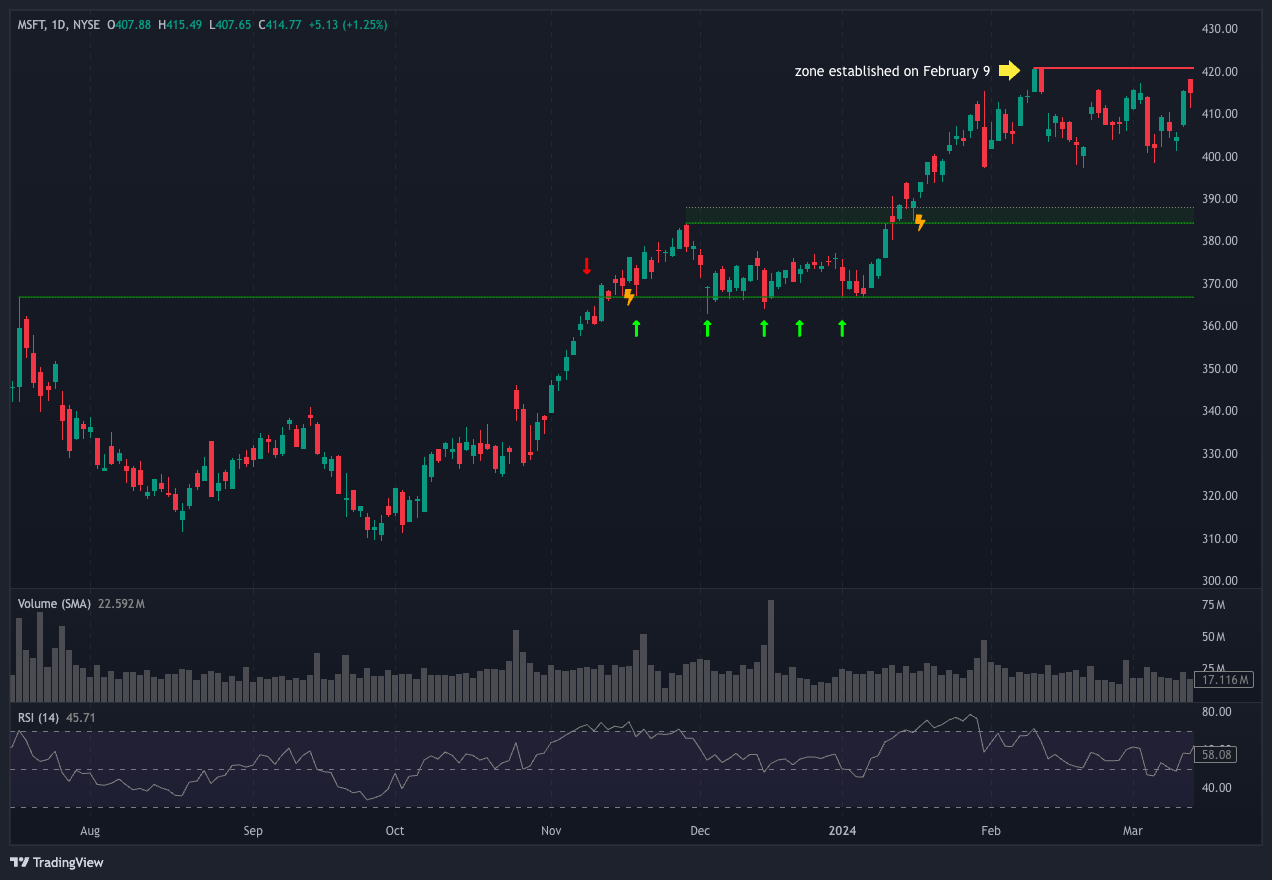
Right away on November 14, 15, and 17, the zone experienced three consecutive retests (Fig.4). These were key in confirming that the former resistance had now turned into a support.
What does this mean in real life?
It means that after the price penetrated the zone, there weren’t enough new buyers to keep pushing the price higher past the zone and keep the trend going.
This also means that the majority of traders (retail, institutional… anyone) placed their LMT orders after the breakout.
Where did they place it?
Well going by the tails on those red retest days—they stepped in precisely where the zone was detected four months prior!
This is a good indication that buyers are showing up at this exact zone. This is further supported by the fact that volume temporarily picked up after the price broke past resistance (Fig.5).
—
Professional traders always use LMT orders and react to the chart.
They do not “forecast” the chart because, well… nobody really knows where the price will go (so beware of anyone who claims otherwise)!
They also do not chase trends… or at least they shouldn’t. And they only buy at levels that make their risk-reward sustainable, and for bigger traders, in zones of high liquidity or high volume.
—
July 2023 zone as a support
Now let’s see how the price behaved once the July 2023 zone became support.
After the zone’s November 10 penetration and subsequent retests, you’ll notice that volume had depleted. This is a sign that buyers weren’t piling in aggressively to push the price further.
And even though MSFT managed to hit a new ATH of $384 on November 29—roughly 5% above our penetrated zone… this was immediately followed by a relatively sharp reversal that brought the price down to $366—right back to the zone.
And just like that, a new zone was born. The November 29, 2023 zone (Fig.6).
This reversal was the market participants’ way of saying “We want more proof that we’re going higher.”
This type of hesitation is common when there is a lot of uncertainty—such as when a stock is at ATH prices, as these are basically uncharted territory.
So four more “proofs,” or retests, were necessary before every last seller at our July 2023 zone finally gave up.
Once they did, price rallied by as much as 15% in 38 days (Fig.7).
Risk vs. Reward
With clearly defined zones and multiple active bounces like these, you get a clear indication of where a setup could break—as that is also the level at which other market participants will likely place their stop losses or give up their bullish views.
For MSFT’s case, we could argue that most buyers who bought previous retests placed their stops at the $350-360 range.
Had price been pushed that far down, chances are the zone would have broken, and a cascade of sell orders (a squeeze) would have caused the stock to tumble all the way down to $310-320.
—
This is what we call a clear High-R/R Setup.
Why? Glad you asked.
Because you have a clear structure, partnered with a somewhat defined risk*.
Your Risk is that the price goes down to your stop loss at $360, breaking the setup. In percentage terms, that’s only about a 2.7% loss (assuming an entry at $370).
But, with the stock having cleared ATH, and with the new support holding multiple retests, there’s a strong case for the Reward potential to be higher than just 2.7%.
*Side note: This is an oversimplification. The risk with stocks is, unfortunately, never truly “defined.” Unexpected news, earnings, even mere tweets can cause sudden price gaps. The only way to truly define risk is through options—but that’s a topic we’ll will cover in a future educational piece.
What happens when the play is there, but things don’t go your way?
Let’s go back to our MSFT analysis.
After its 15% rally in early 2024, the stock formed another temporary top before pulling back and consolidating.
And as you know by now, this was what gave us the February 9, 2024 zone (Fig.8).
In March, the stock managed to break above its most recent zone, but quickly lost momentum and spent the next few weeks in a consolidation phase.
The zone acted as a support this entire time, but the price went nowhere. This is actually quite common, and if you can recall, this is also what happened with our July 2023 zone (Fig.9).
You’ll also notice that while our July zone had a much clearer penetration and bounce pattern, the February one did not. This last penetration was much more timid and uncertain.
When this happens, you are face with a dilemma:
“Do I take a long position, or do I just look somewhere else?”
In the hypothesis of going long, you can still use our zones as a compass for your trade. Let’s play it out…
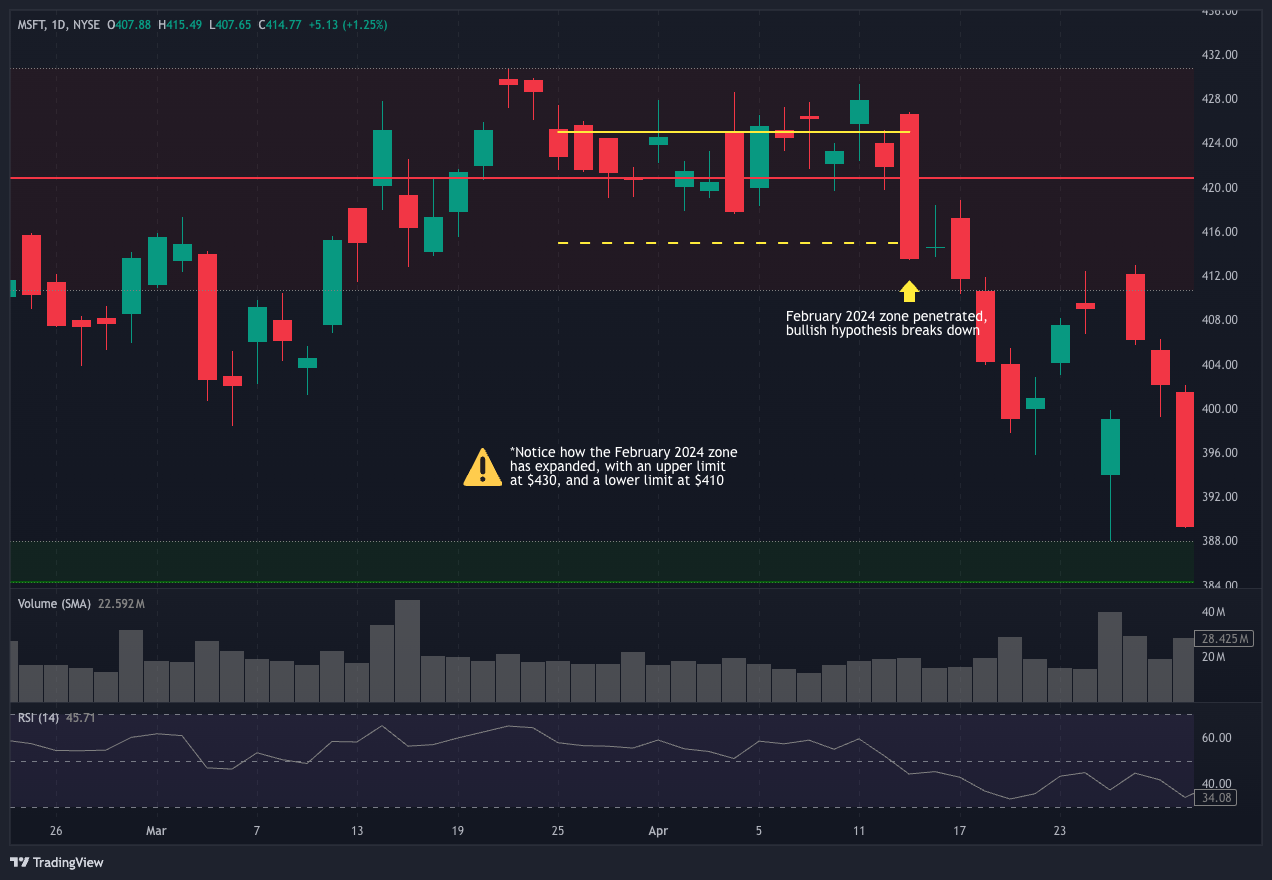
If you entered a trade while MSFT was in consolidation—let’s say $425—you would place your stop right below the zone, around $415 (Fig.10).
For a potential loss of only 2.3%, you would have made a bullish bet on another High R/R Setup.
And looking at that big red candle on April 15, that bullish bet would have indeed been lost following the break of our support (Fig.11).
And that’s just the cost of doing business. No strategy will ever give you a 100% win rate (unless maybe if you’re Nancy Pelosi).
But what makes you money in the long run is Insider Trading the Risk Management (i.e. entry, exit, and sizing) of such trades—something our Zone Algorithm can help with immensely.
In Part 2 of this Chart Analysis series, we’ll break down:
How and Why our algorithm expanded the February 2024 zone to include the “fake” breakout
How that adjustment helped catch multiple near-perfect 8-12% bounces in May and August 2024.
See you then!


