
High ROIC, Low P/FCF, and Zoned In (June 25 2025)
Your Quantamental guide to the the most promising trade setups in the market
Hey folks,
If you’ve been hanging around here long enough, then you probably already know the drill every Tuesday: stocks near zones, bounce or penetrate, rinse and repeat.
But since the Trading Places app already does a great job providing real-time alerts for short-term trades anyway… we figured, why not switch up the newsletter a bit?
So in this all-new Zone Alert, we’re zooming out and focusing on the bigger picture—longer-term, high-conviction setups you can sit on for months, not days.
But don’t worry, the classic Zone Alerts aren’t going anywhere—you’ll still catch them on X and Substack Notes from time to time.
So what’s new?
Starting this week, we’re rolling out a more in-depth series using a Quantamental methodology—basically combining quantitative techniques and fundamental analysis in order to surface setups with serious mid-to-long term potential (6-24 months).
What we’ll be looking at
Instead, our focus is going to be on solid, efficient and undervalued companies that tend to hold up (or even outperform) during periods of uncertainty.
There are a lot of ways to define that kind of setup—but to avoid overcomplicating things, we’ll keep it simple with these three core criteria:
High ROIC (15%+)
Good growth (5%+ CAGR)
Attractive valuation (P/FCF in the top 20th historical percentile rank)
We’re using Koyfin, but you can use any stock screeners (Finviz is free) to replicate what we’re doing here.
Why these three?
High Return on Invested Capital (ROIC)
ROIC (Return on Invested Capital) measures how effectively a company turns its invested capital into profit. When a company’s ROIC exceeds its Cost of Capital (WACC), it creates value for shareholders.
Think of it this way: if a business can deploy capital at a 25% return while its WACC is just 10%, it earns a 15% value-creating spread. And if those returns can be reinvested at similarly high rates, the company becomes a compounding cash-generating engine, a hallmark of long-term wealth creation.
In a nutshell, ROIC tells us how good the business and its management is in generating value.
MSFT and AMZN are among the most efficient of the large cap companies with ~27% ROIC year after year. TSLA and PLTR, meanwhile—two popular names among retail traders—are in the low single digits.
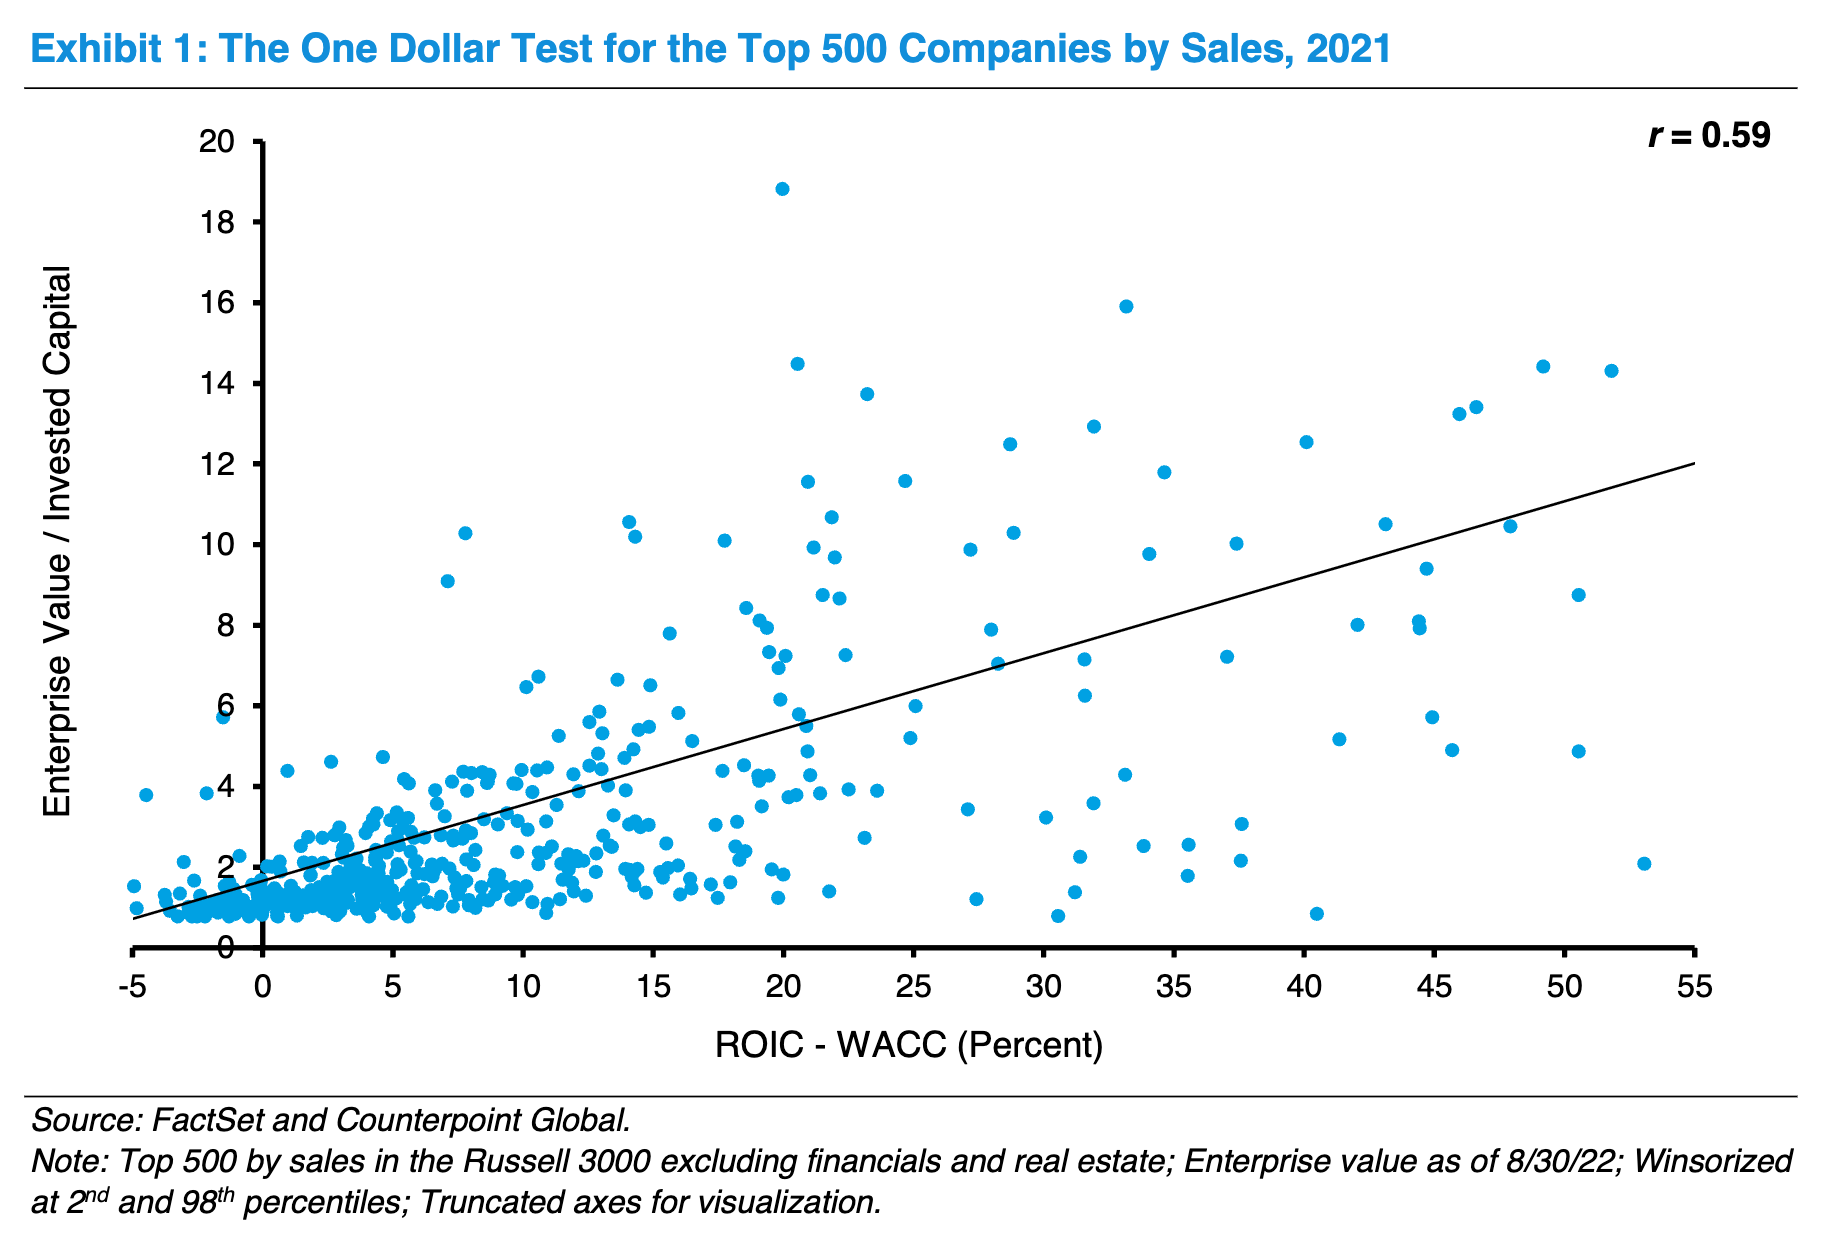
And ROIC’s not just theoretical. As you can see from the Morgan Stanley chart above (and as discussed in more detail in this paper), the market tends to assign higher multiples to stocks with a higher ROIC.
In other words, the stock market clearly recognizes ROIC as a value metric.
Sustainable growth (Total Revenues CAGR)
Forget flashy one-offs; we’re looking for at least three years of compound top-line growth.
If margins and working-capital demands stay in check, that steady climb tends to kick out extra cash the company can reinvest at the usual ROIC.
It’s a solid clue that customers genuinely want what it’s selling.
Attractive valuations (P/FCF)
We’re also checking where these stocks are trading compared to their respective histories, i.e. whether their Price-to-Free-Cash-Flow is the cheapest it’s been in the last few years (or at least close to it).
No sense paying up for potential if the market’s already priced it in—especially in this uncertain climate.
You could actually use different metrics for valuation (P/E or P/S for example). But since we’re screening for mature, cash-generating businesses, P/FCF is often a better metric.
Nearing a potential bounce/penetration (Zones)
Well this wouldn’t be a Trading Places newsletter if it didn’t involve Zones.
So once we’re certain about the fundamental solidity of our picks, we’ll also be letting our zones to do what they do best: time our moves.
As usual, we’ll optimize potential entries, exits, and stops by positioning them around key zones… because otherwise, what is even the point?

Tl;dr: we’ll be looking at capital efficiency, real growth, value, and timing.
Disclaimer: This is by no means an exhaustive list of criteria for evaluating the quality of a business. Always do your own research—dig deeper into the company’s financials (especially debt sustainability), listen to earnings calls, and ensure you have a clear understanding of the types of risks the company is exposed to.
What’s in this issue:
• High-potential opportunities
• This week’s most actionable setup
• What are zones?
Btw, you can always cross-check our zone analysis by heading over to the app and exploring the Scanner, Hot Picks, and Chart features for yourself. It’s free!
Our Quantamental screen results
Here are some of the names that popped up on our screens this week:
1. Colgate-Palmolive Company (CL)

ROIC: 37.24%
Revenue CAGR (3Y): 3.74%
P/FCF (3Y Rank): 3rd percentile
2. Adobe Inc. (ADBE)

ROIC: 36.38%
Revenue CAGR (3Y): 10.22%
P/FCF (3Y Rank): 3rd percentile
3. Crocs, Inc. (CROX)

ROIC: 28.65%
Revenue CAGR (3Y): 12.40%
P/FCF (3Y Rank): 9th percentile
4. Erie Indemnity Company (ERIE)

ROIC: 27.45%
Revenue CAGR (3Y): 13.76%
P/FCF (3Y Rank): 8th percentile
5. RLI Corp. (RLI)

ROIC: 17.50%
Revenue CAGR (3Y): 15.47%
P/FCF (3Y Rank): 1st percentile
Most actionable setup this week: CROX
Consumer Cyclical • Footwear & Accessories • USA • NASD
We can’t blame you for not wanting to waste eye health looking at Crocs (the sandals), but you’d be amiss not to take a second look at CROX (the stock).
With a 28.65% ROIC, the company seems to be doing quite well putting their capital to work. This puts Crocs comfortably above some of its Consumer Discretionary peers such as SKX, UAA, SHOO, and even NKE.

The 12.4% revenue CAGR over the last 3 years, on the other hand, tells us that there’s nothing slow-footed about this footwear company.
Thanks to product-market fit with Gen Z and healthcare workers everywhere, Crocs has seemingly attained sustainable, multi-year growth—with plenty of room to run.

Despite that, CROX is trading at a P/FCF at the 9th percentile vs. its 3-year history—meaning its current price (as of writing) of $99.12 appears to be a pretty good deal for a business with its quality.

Now turning back to our chart, you’ll see that CROX has very recently bounced off its May 2021 zone. It’s a support that—for the most part—has held up reliably over the past few months.
Buyers have consistently stepped in and pushed it higher whenever the stock dipped into this area. And the way Monday’s candle left a long tail ending right at the bottom of the zone only reinforces that strength.
If this bounce holds, it could mark the beginning of a bigger, longer move up.
—
All things considered, CROX stands out as one of the top profiles on this week’s list—strong fundamentals, attractive valuation, and great timing.
That’s a wrap for today’s issue of our all-new Quantamental Zone Alert. We’ll be back next week with fresh setups nearing key zones.
In the meantime:
Want to find more immediate setups?
The Trading Places platform is live—and free! Head on over and check out the Zone Scanner and Live Hot Picks.
Like this new format of Zone Alert?
Or do you still prefer the old one? We’d love to hear what you think! Join our subscriber community to drop your feedback.

Disclaimer: This isn't financial advice. This shouldn’t be news to you.