
Hot Zone alert - March 4 2025
Your weekly guide to the the most promising trade setups in stocks, crypto, and currencies
Hello, one and all!
Another week, another batch of zone alerts… brought to you by the Trading Places zone algorithm.
To those of you who are new here—welcome to your first Zone Alert. A series where we power up the our good ol’ zone scanner to look for stocks sitting near key support and resistance zones, and analyze where the action might take us.
These alerts help you focus your attention to setups that could yield you the best returns while keeping risk management in check.
And to our long-time readers—you already know the drill. We've got three live ones for you this week.
What’s in this issue:
• Who we are
• This week’s three new hot zones
• What are zones?
But wait… who are you people and what am I doing here?”
Welcome to Trading Places.
We’re just a bunch of market nerds, quants, and posers who’ve spent years deciphering price action, identifying high-probability setups, and questioning our life choices every time a chart pattern didn’t play out as planned.
After years of refining our approach, we built a quantitative system that cuts through the BS. Our algorithm highlights key market Zones—areas on the chart where real money moves, not just speculative noise.
Think of it as an edge—scanning stocks, currencies, and crypto in real-time to pinpoint where your attention is required.
Every week, we share these insights with you. No fluff, no hype—just actionable setups backed by real market dynamics.
Here’s what our zone algo picked up for you this week:
Lumentum Holdings Inc. (LITE)
Technology • Communication Equipment • USA • NASD

After spending months chasing one 52-week high after another, LITE took a nearly 40% nosedive in just over a month.
And as of yesterday, it landed on a very old support, the October 2018 zone.

The October 2018 zone has held strong historically, only breaking once since its inception—during that huge post-earnings gap down in November 2022.
If LITE bounces here, there’s a massive potential upside—a move back up to the February 2022 zone could net 20+%.
But if it breaks, the downside risk is manageable. Setting a stop just below the zone would mean a loss of only 5-6%.
It’s already a pretty safe R/R setup as it is—but a confirmed bounce would make this play an even clearer winner.
Idex Corporation (IEX)
Industrials • Specialty Industrial Machinery • USA • NYSE

IEX is currently sitting on its September 2020 zone. It’s one that has refused to break since 2022 despite multiple retests.
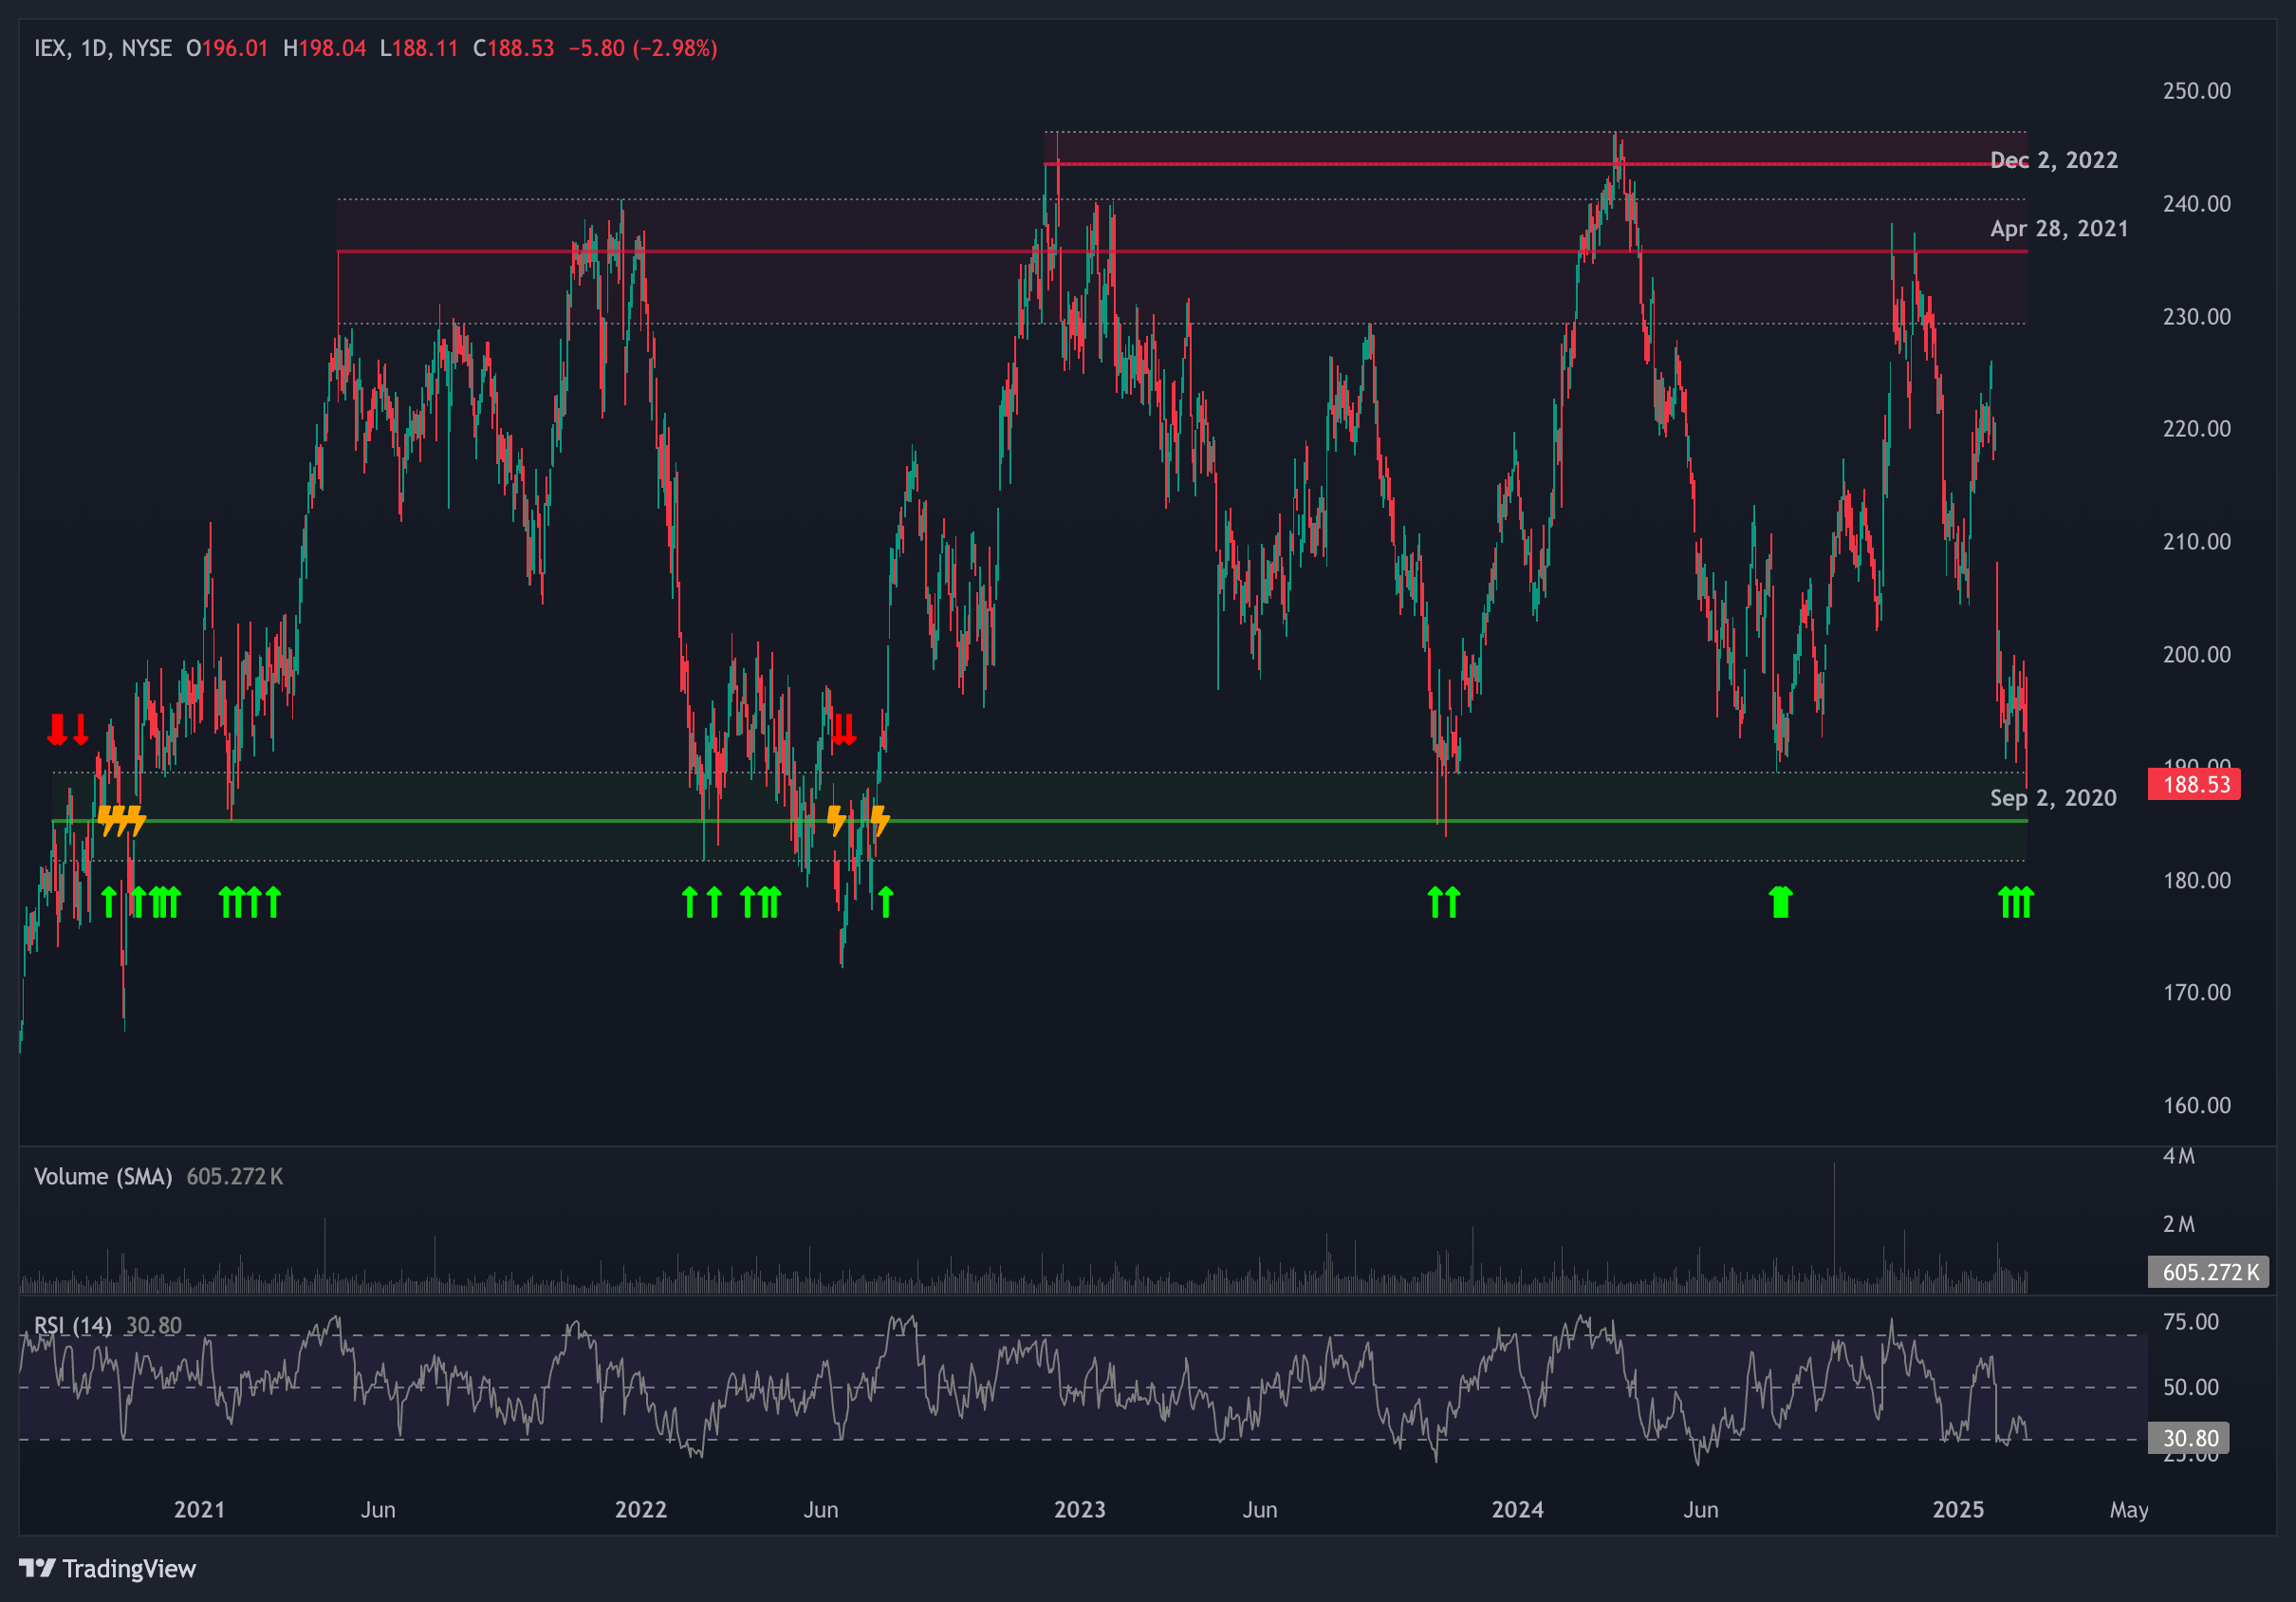
And even on instances when it did break, the sell-offs were short-lived. It seems the $181-189 range is just too enticing for the market.

Currently, IEX is near the upper edge of the zone, with RSI still at 30. That means it could still very well dip to the middle or bottom of the zone before a bounce happens.
While entering here—with a stop at around $180—would be an already safe bet (4% loss if it breaks), waiting for a bounce confirmation would benefit it immensely.
Our first potential target, should the rebound materialize, is the April 2021 zone for a gain of 20+%.
Microsoft Corporation (MSFT)
Technology • Software - Infrastructure • USA • NASD
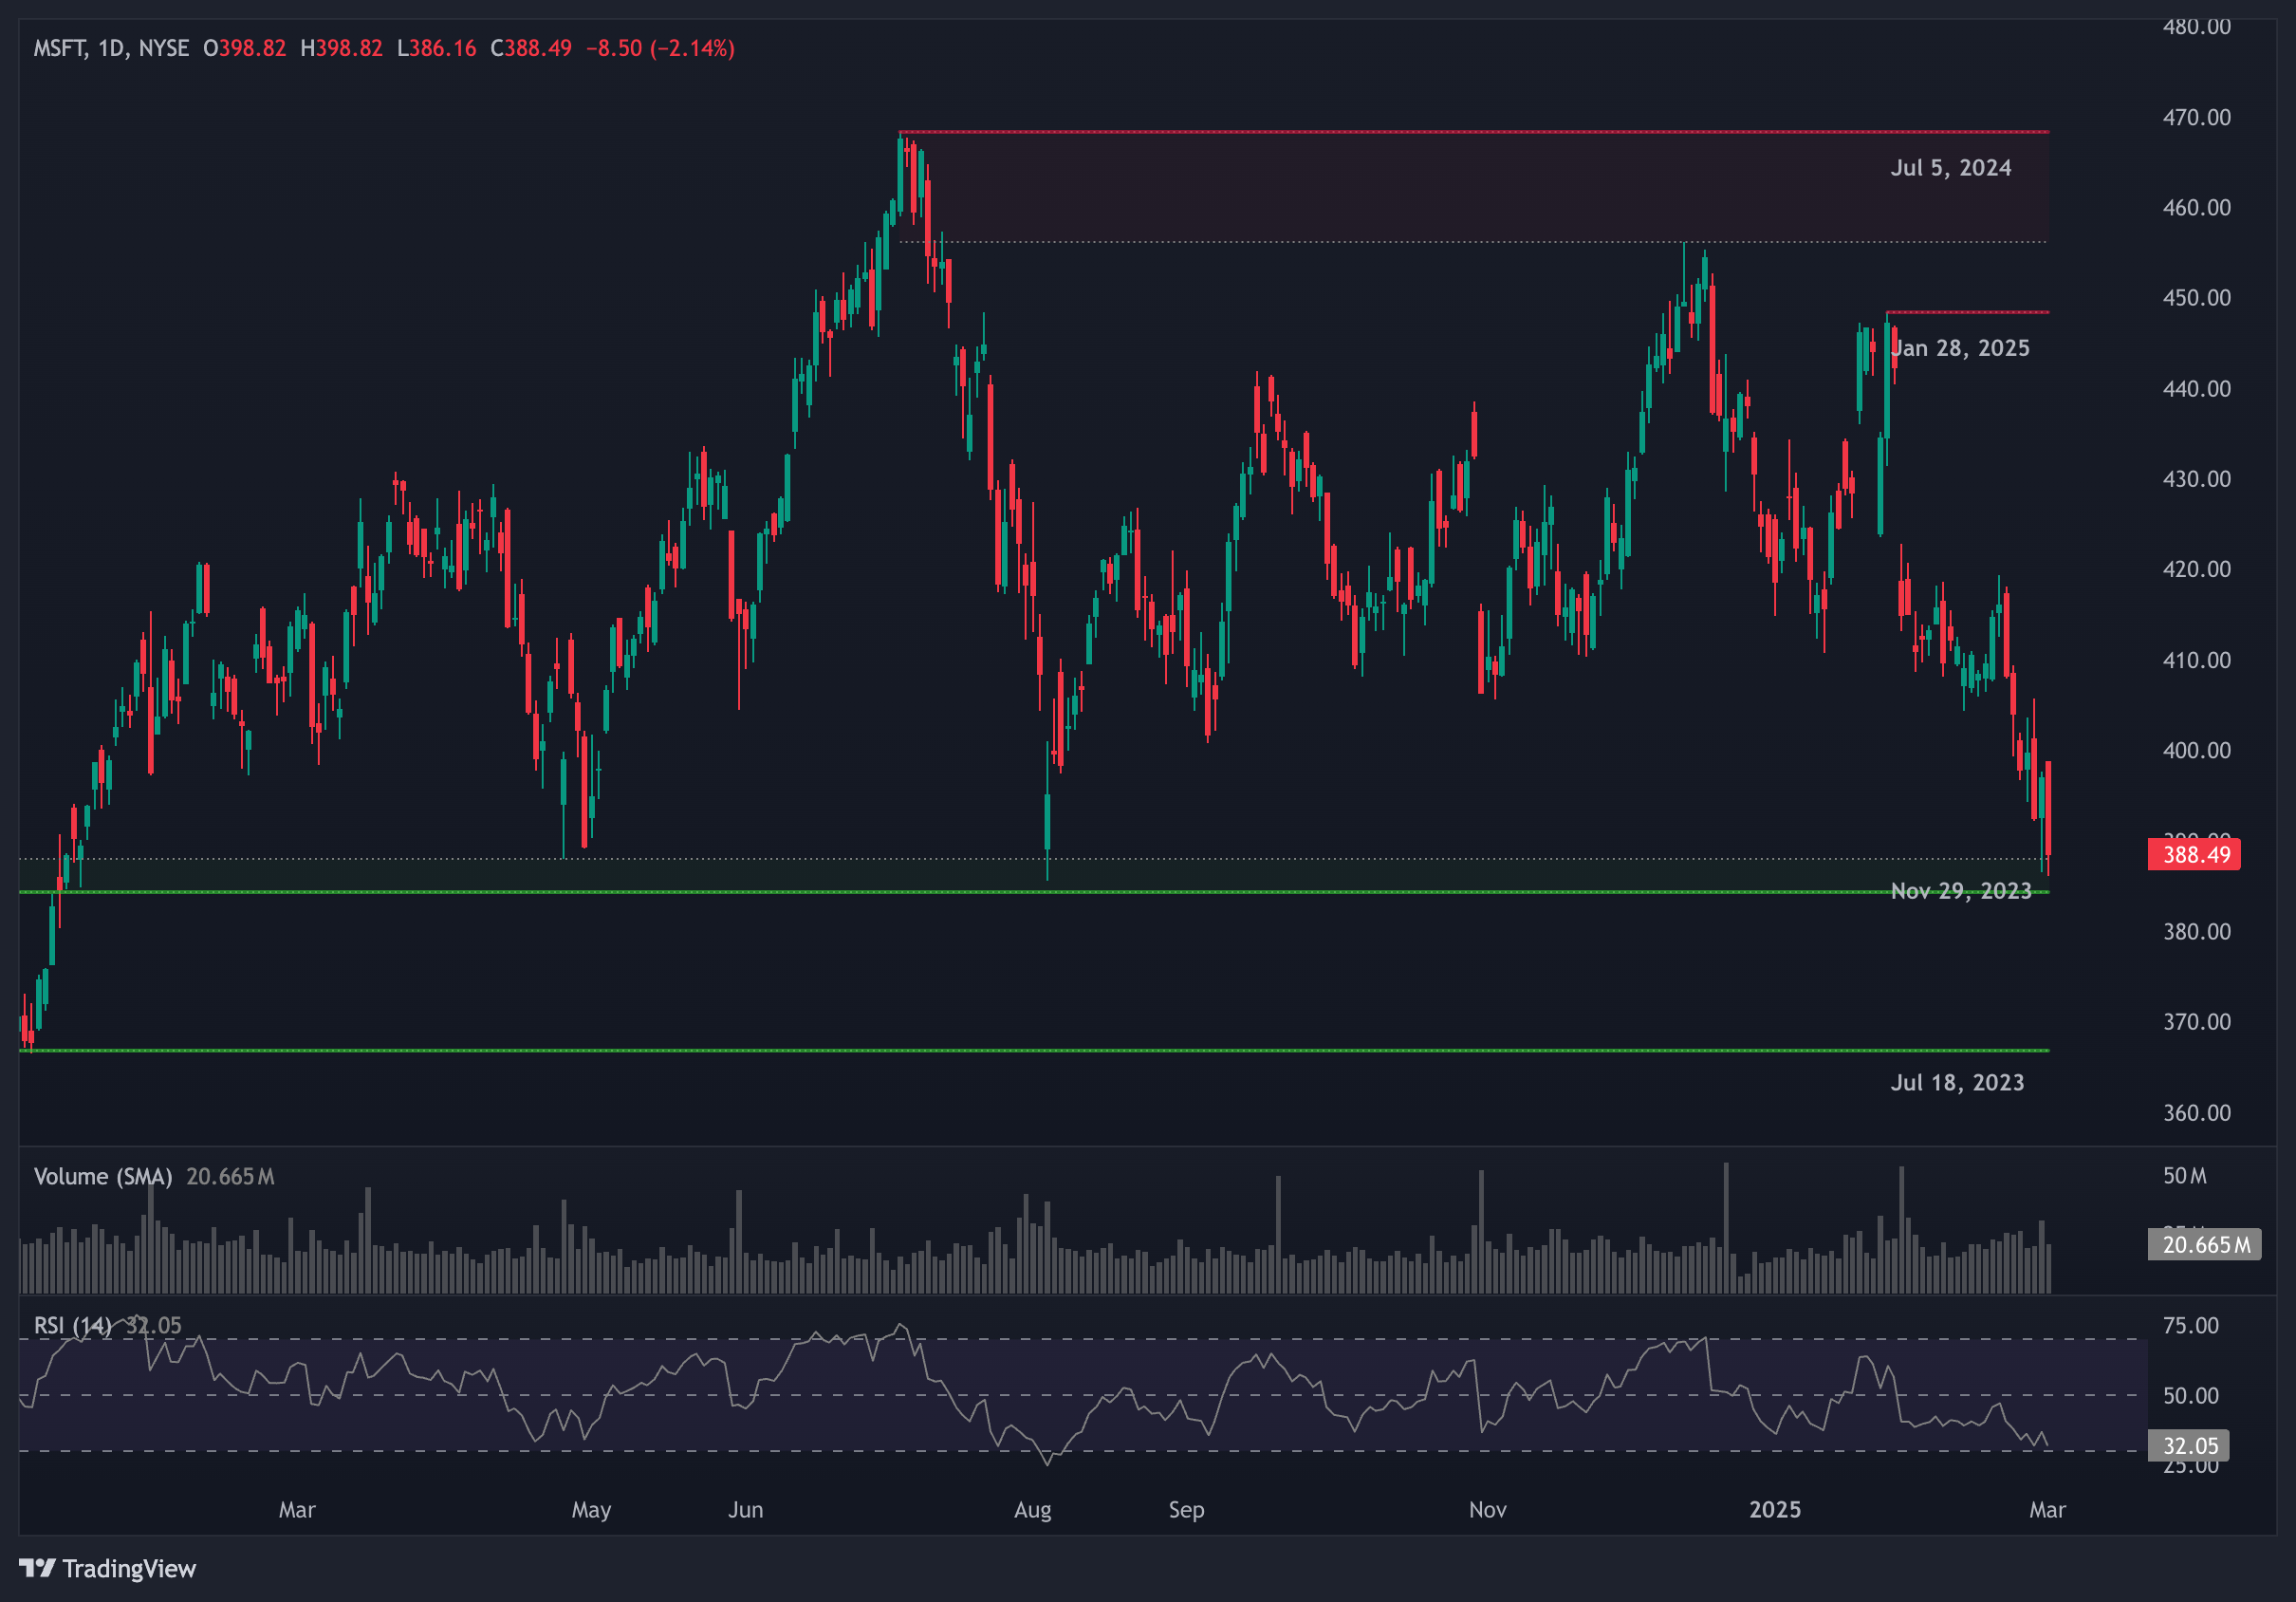
If it feels like we’ve been talking about this stock a lot lately, well… that’s because we have.
MSFT was recently used as the real-world case study in our “How to Trade Zones” educational series, and flagged in one of our bonus zone alerts on Substack Chat.

But how could we not, when MSFT’s price action almost always gives our zone algo the validation it craves deserves.

And right now, it has another chance to do that.
See, MSFT is atop its November 2023 zone. As a support, it’s yet to be penetrated—with each retest resulting in at least a 10% gain (one even led to the stock’s most recent ATH).
If it bounces again, there’s a chance price might get held up a bit in the $400-408 range, as it has served as a formidable zone in recent months. But if momentum holds, there’s a strong case for MSFT climbing back to the January 2025 or July 2024 zones—which would yield 15-20%.
WTF are Zones, anyway?
Zones are key price levels where the market has reacted strongly in the past—such as sharp reversals or sudden swings.
They’re areas where actual supply and demand met in the past, and likely will meet again.
“Why are these significant?”
Well, it all comes down to three key principles. We like to call them The Principles of:
When I Dip, You Dip, We Dip (aka psychology)
Traders are aware that others are watching these levels (zones) too. With everybody paying attention, this creates a self-fulfilling prophecy where everybody acts in anticipation of everybody else’s actions.
Markets Gonna Market ¯\_(ツ)_/¯ (aka technical factors)
If the first price rejection at the top of a zone was violent, it’s likely that buyers who entered at that level are now holding losses.
But with each retest, the rejection weakens, as there are fewer buyers remaining underwater. This weakens that resistance (or support for all you short-sellers), and could eventually lead to a break through.
Killer Whales (aka institutional plays)
Big players need liquidity in order to place massive orders without moving the market against themselves. So they wait for these zones, knowing a lot of us small fry (retail traders) will come to play.
This allows them to buy low or sell high without causing a lot of waves.
But remember: Zones are NOT guarantees but rather regions of increased probability for market moves. So always, ALWAYS use proper risk management.
Trading Places: Launch coming soon!
Stop obsessively refreshing your charts like it’s your ex’s Instagram.
By combining historical patterns with real-time market data, Trading Places identifies zones and assigns probabilities to each one—helping traders spot potential plays with higher chances of success.
It automates all of the curation, chart-plotting, and alerting for you, so you can actually have a life (or at least pretend to)!
Stay tuned!
Disclaimer: This isn't financial advice. This shouldn’t be news to you.