
Make America Green Again (21 Jan 2025)
Turn your portfolio green with these new hot zones
Ah, Inauguration Day! The changing of the guard. The ceremonial reshuffling of power.
A time to shake things up and start fresh.
Out with the old, in with the… slightly less old. (Just kidding, President Trump.)

So here we are again, bracing for the winds of change. New plans, new policies, new faces… But the market isn’t exactly rolling out the welcome mat just yet.
While 47’s first term saw a market upswing post-inauguration, this time around, optimism feels more like it’s been tempered with some caution.
Uncertainty over tax cuts, deregulation, tariffs, strategic reserves… meme coin shenanigans. It’s all still a bit of a mixed bag. And it’s left everyone trying to figure out where this thing is headed.
But maybe that’s not such a bad thing.
We could all do well with a little extra caution right now—especially when it comes to spotting opportunities in this shifting landscape.
And that’s why we’ve highlighted three new zones for you to look at this week.
What’s in this issue:
• Who we are
• This week’s three new hot zones
• What are zones?
But wait… who are you people and what am I doing here?”
Welcome to Trading Places.
We’re just a bunch of market nerds, quants, and posers who’ve stared at enough charts we dump our portfolios at the sight of a menorah.
After years of convincing ourselves that the lines and shapes we were plotting actually meant something, we finally figured it was time to upgrade our shtick a tiny bit.
So now, we get quant intelligence to do it for us.
We built an algorithm that’s deaf to the market’s siren songs. It cuts through the BS and pinpoints Zones of interest, i.e. places on the chart where actual money comes to dance.
Think of it as a Limitless pill for your stock, currency, and crypto plays—scanning the markets in real-time and determining where the action’s at.
 - S02E09 Black Friday | Video gifs by quotes | 413d0553 | 紗")
This week’s hot zones!
Some stocks our zone scanner picked for you today:
Citigroup Inc. (C)
Financial • Banks - Diversified • USA • NYSE

The good news: Citigroup dropped their earnings report a week ago, and it was a good one—surpassing analysts’ estimates by nearly 10%.
This led to a big gap up and a sweet 8% gain for anyone holding C when the news hit.
The bad news: As of writing, the stock is inside a zone from January 2018. One that’s so strong it has foiled the stock’s attempts at a new all-time high three separate times.
For anyone long on C, this could mean…

BUT, there’s still hope. The growing volume during this recent surge, plus the price action today, could be hinting at another ATH attempt. Maybe fourth time’s the charm?
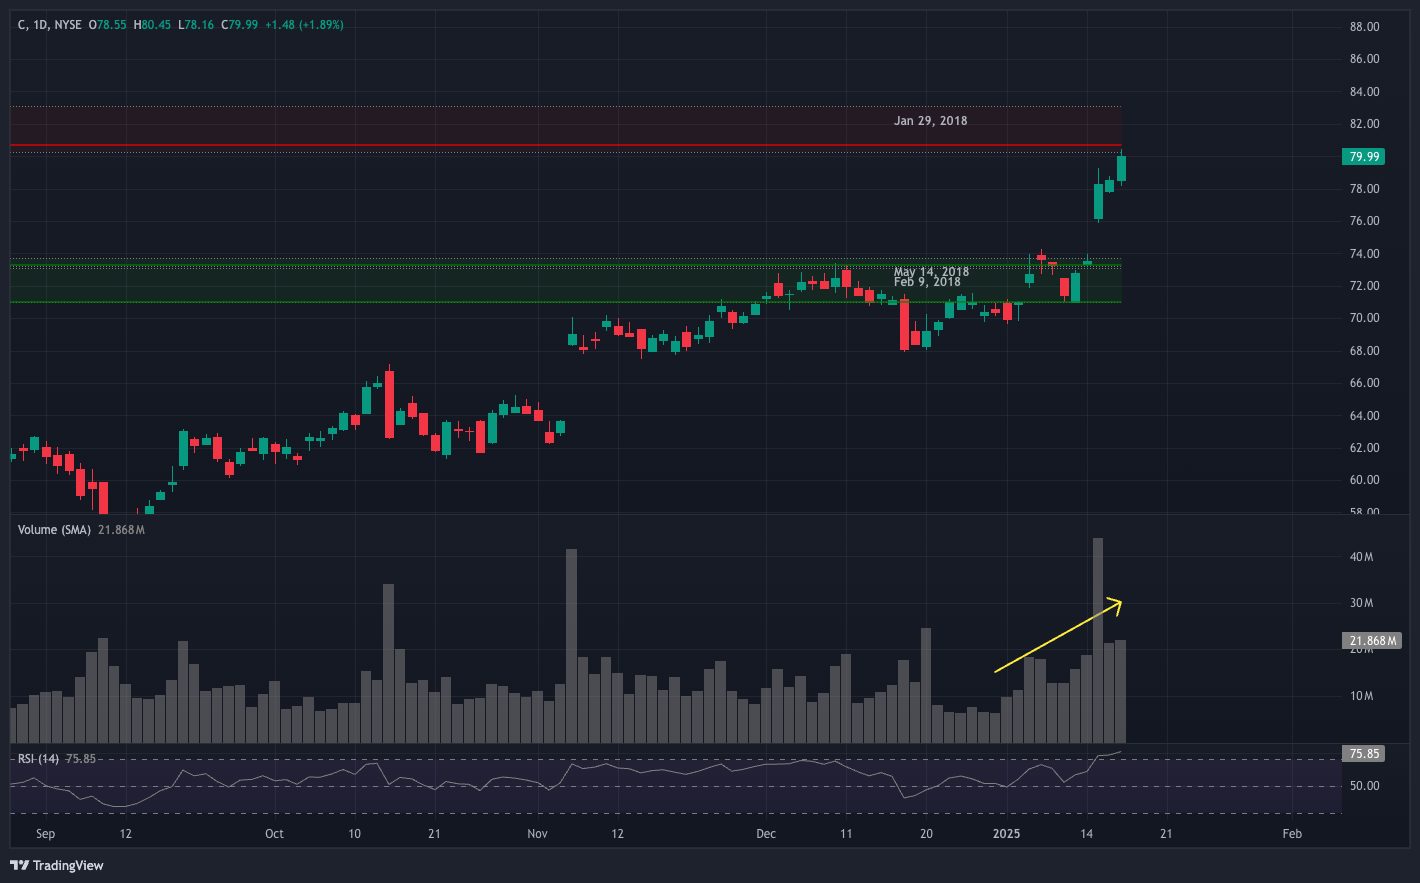
For short sellers, though, this triple-top resistance might look like an invitation.
It could cause a bounce down to either the May 2018 zone (covering here offers a decent 8% gain), or perhaps even the February 2018 zone (up to 11%).
HP Inc. (HPQ)
Technology • Computer Hardware • USA • NYSE

HPQ’s November 2021 zone has always been a reliable support. It’s been tested repeatedly. It’s yet to be broken in half a year.
That alone could warrant a zone alert if we’re being honest.
But, zoom in a bit, and things get even more interesting…

Looking at the RSI trend, there’s a clear bullish divergence across the last three retests of this zone.
And with current RSI still in the 30s, this points to a potential rebound. If that happens, the first target could land somewhere within the May 2011 zone, for a 6-10% gain.
Nike, Inc. (NKE)
Consumer Cyclical • Footwear & Accessories • USA • NYSE

Let’s all pour one out for Nike.
A storied company in a stable sector. Leading market share by a mile. Consistently solid earnings. Decent-to-good valuations.
Yet here it is, a victim of risk-on rotations and slowing growth. Blame NVDA, TSLA… hell, maybe even $TRUMP and $MELANIA. Add to that Hoka as well.
This has caused NKE to tumble to its lowest price since the early days of the pandemic (before everyone discovered running).

Currently, it’s hovering around its June 2018 zone.
Scratch that: it has actually penetrated the zone last Friday… but only barely. More on that later.

Right now, there’s hope. If it holds, we could be seeing a bounce back up to the zone above, delivering a potential 5.5-10% profit.
But, as mentioned earlier—this current zone has shown some cracks. It can be broken. If this happens again…
Let’s just say, the last time it happened, there was a -16% price drop.
We’ll be sure to keep an eye out on that too. So stay tuned on X.
WTF are Zones, anyway?
Zones are key price levels where the market has reacted strongly in the past—such as sharp reversals or sudden swings.
They’re areas where actual supply and demand met in the past, and likely will meet again.
“Why are these significant?”
Well, it all comes down to three key principles. We like to call them The Principles of:
When I Dip, You Dip, We Dip (aka psychology)
Traders are aware that others are watching these levels (zones) too. With everybody paying attention, this creates a self-fulfilling prophecy where everybody acts in anticipation of everybody else’s actions.
Markets Gonna Market ¯\_(ツ)_/¯ (aka technical factors)
If the first price rejection at the top of a zone was violent, it’s likely that buyers who entered at that level are now holding losses.
But with each retest, the rejection weakens, as there are fewer buyers remaining underwater. This weakens that resistance (or support for all you short-sellers), and could eventually lead to a break through.
Killer Whales (aka institutional plays)
Big players need liquidity in order to place massive orders without moving the market against themselves. So they wait for these zones, knowing a lot of us small fry (retail traders) will come to play.
This allows them to buy low or sell high without causing a lot of waves.
But remember: Zones are NOT guarantees but rather regions of increased probability for market moves. So always, ALWAYS use proper risk management.
Trading Places: Launch coming soon!
Stop obsessively refreshing your charts like it’s your ex’s Instagram.
By combining historical patterns with real-time market data, Trading Places identifies zones and assigns probabilities to each one—helping traders spot potential plays with higher chances of success.
It automates all of the curation, chart-plotting, and alerting for you, so you can actually have a life (or at least pretend to)!
Stay tuned!
Disclaimer: This isn't financial advice. This shouldn’t be news to you.