
Recapping past zones (April 25 2025)
A follow-up to our weekly zone alerts
Hey everyone!
Welcome to another issue of Zone Update—our weekly catch-up where we revisit previous alerts to see how they fared, and dig into how price action reacted to key zones.
In keeping with the recent launch of our online tool, we’re still keeping things a bit interactive this week.
We’ll be including a few setups from the latest Zone Alert so you can follow along on the platform, and do your own analysis as the plays unfold—we’d love to hear them!
So if you’re not signed up yet, just click the button below to redeem your free access:
Coming soon: the Trading Places platform on mobile 📲
We heard you and you’re right—zones should not be shackled to desktops. That’s why we’re working hard to make your Trading Places mobile experience way better.
Stay tuned!
In case you’re new here, each week we highlight stocks nearing or entering Hot Zones, i.e. key levels on the charts with great risk-reward setups. Stay tuned and subscribe to get these alerts before anyone else!
Check out this week’s hot zones:

Sarepta Therapeutics, Inc. (SRPT)
Healthcare • Biotechnology • USA • NASD
Zone alert: April 1 2025

We’re starting off with an alert that has already played out.
SRPT caught our attention after a brutal 20+% gap down in March, bringing its YTD loss to nearly 50%. If that wasn’t bad enough, an FDA official who many consider as a biotech ally had just stepped down—adding more fuel to this dumpster fire.
This free fall brought the stock down to a key zone dating back to 2016.
While it didn’t look too promising, we noted that this zone had been a strong support in the past. So we flagged it with the hope that bulls might be able to squeeze in a quick bounce.
But we also warned that should bearish sentiment remain strong, SRPT could drop fast… and far.

Well, our algorithm registered a zone penetration confirmation the very same day the alert came out.
If that ain’t a sign to short… we don’t know what is.

We also said in our alert that the stock “could come tumbling 12% down toward the October 2013 zone (or even further)”—well, it didn’t take long to do so.
SRPT managed to hit its October 2013 support in only three days. But with selling volume still elevated, you could have easily held on further down to the July 2013 zone—for an additional 13% downside.
View SRPT’s chart and zones here
Now onto our too-soon recaps…
Realty Income Corp. (O)
Real Estate • REIT - Retail • USA • NYSE
Zone alert: April 22 2025

O made the cut into our Alert newsletter because the signs of a potential bounce were too strong to ignore.
It was at a major zone that had rejected four previous breakout attempts in the past four months. Plus, the explosive rally it was just on was accompanied by a decline in volume that was just as stark.
We said that the April 2016 zone could once again hold—and O could find itself falling back down to the November 2016 support if it did.
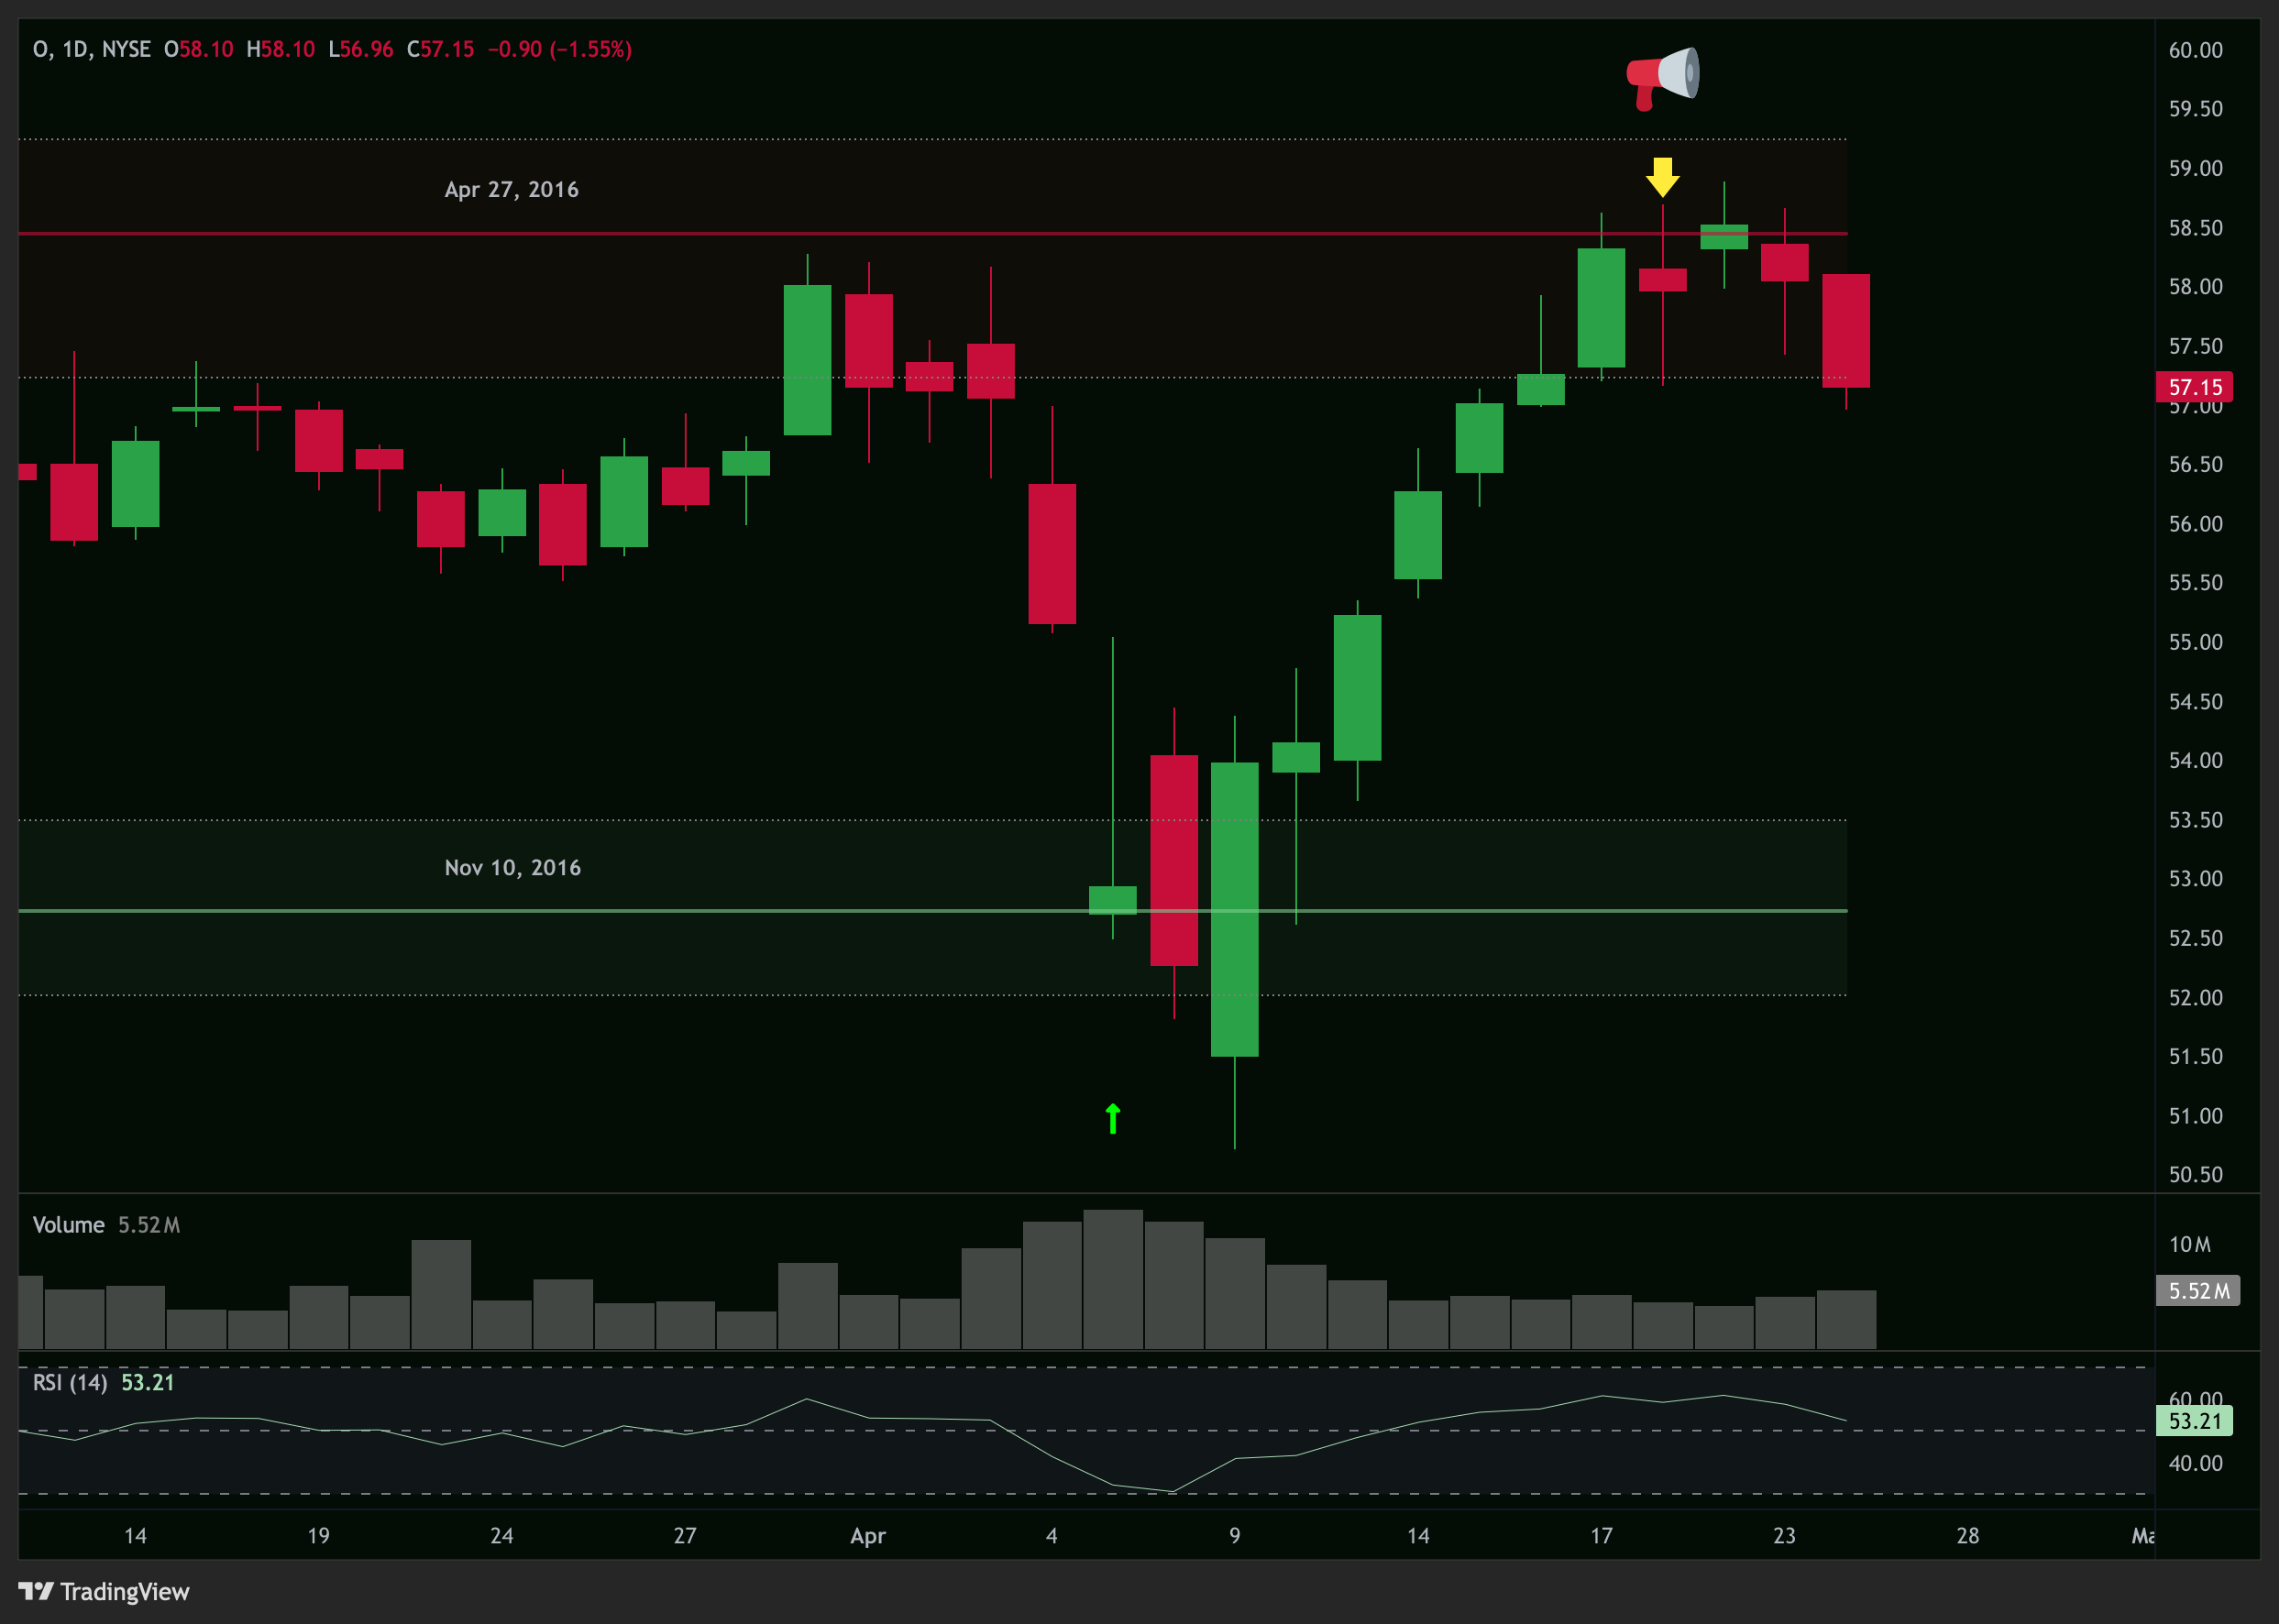
Still too early to call—but so far, the move’s looking in line with our thesis.
As of writing, it’s already a smidge below the resistance zone, but we do not have an assurance of a bounce just yet.
Will O get rejected again—or is this finally the time it breaks through?
View O’s chart and zones here
Bristol-Myers Squibb Co. (BMY)
Healthcare • Drug Manufacturers - General • USA • NYSE
Zone alert: April 22 2025

BMY had been on a two-week rampage before getting picked up by our zone scanner. It was a falling knife that no one wanted to catch—committing elder abuse on some very old zones in quick succession.

However, what stood in its way next was the September 2013 zone. It’s a major support that had held respectably against multiple retests last year.
Moreover, BMY’s recent freefall also sent its RSI down to oversold levels.
We figured that there’s a good chance this Zone + RSI combo could be a catalyst for a decent bounce.

The stock has since dipped into the September 2013 support and is now sitting squarely within it.
It seems to be holding firm so far—volume spiked as soon as the stock hit the zone, which means buyers are stepping in at this level.
However, until price decisively moves upward, bulls aren’t completely out of the woods yet.
What do you think—will this zone hold? Or is BMY headed lower before it catches a real bid?
View BMY’s chart and zones here
—
That’s it for this week’s recap.
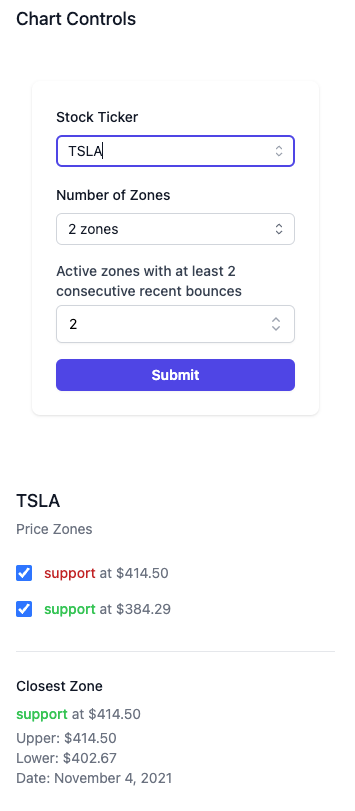
With the Trading Places platform now live, you can:
• Watch these setups unfold in real time
• Adjust zone parameters
• Run your own scans
Let us know what you think—and don’t forget to claim your beta invite if you haven’t already.
See you next week for Zone Alerts!
WTF are Zones, anyway?
Zones are key price levels where the market has reacted strongly in the past—such as sharp reversals or sudden swings.
They’re areas where actual supply and demand met in the past, and likely will meet again.
“Why are these significant?”
Well, it all comes down to three key principles. We like to call them The Principles of:
When I Dip, You Dip, We Dip (aka psychology)
Traders are aware that others are watching these levels (zones) too. With everybody paying attention, this creates a self-fulfilling prophecy where everybody acts in anticipation of everybody else’s actions.
Markets Gonna Market ¯\_(ツ)_/¯ (aka technical factors)
If the first price rejection at the top of a zone was violent, it’s likely that buyers who entered at that level are now holding losses.
But with each retest, the rejection weakens, as there are fewer buyers remaining underwater. This weakens that resistance (or support for all you short-sellers), and could eventually lead to a break through.
Killer Whales (aka institutional plays)
Big players need liquidity in order to place massive orders without moving the market against themselves. So they wait for these zones, knowing a lot of us small fry (retail traders) will come to play.
This allows them to buy low or sell high without causing a lot of waves.
But remember: Zones are NOT guarantees but rather regions of increased probability for market moves. So always, ALWAYS use proper risk management.
Trading Places: Launch coming VERY soon!
Stop obsessively refreshing your charts like it’s your ex’s Instagram.
By combining historical patterns with real-time market data, Trading Places identifies zones and assigns probabilities to each one—helping traders spot potential plays with higher chances of success.
It automates all of the curation, chart-plotting, and alerting for you, so you can actually have a life (or at least pretend to)!
Stay tuned!
Disclaimer: This isn't financial advice. This shouldn’t be news to you.