
Recapping past zones + Your free access to test our Zone Algo
A follow-up to our weekly zone alerts
GM everyone!
Beta Launch week is here!
If you’ve been one of our most active subscribers, your Trading Places invite should already be sitting in your inbox.
If not (or if you haven’t seen it yet because who the hell checks their Promotions tab anyway)—no worries. You can still grab your free beta pass here:
P.S. The platform works best on desktop (or at least an iPad). So if you’re reading this on your phone, snooze this email for the next time you’re on a computer (GMail: long press → Snooze / Apple Mail: long press → Remind me).

Since we’re all on holiday, we figured we’d keep this recap pretty chill. We’ll do a quick check-in on the alerts we sent out just this past Tuesday—to see how key zones have held up so far.
This recap’s premature for sure—normally we wait for setups to play out before including them here…
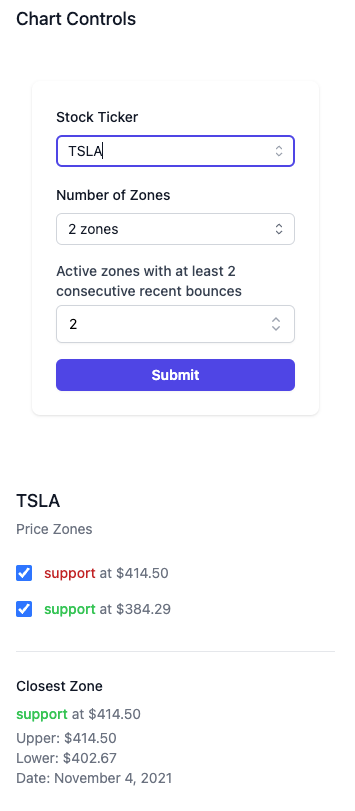
But with the platform now live, you can pull up the charts, mess around with the parameters, and stress-test our alerts while they’re still unfolding.
And of course, we’d love to hear what you think. Not just about the zone analyses, but also the new features on the platform—Interactive Charts, Proximity Scanner, and Hot Picks.
Let’s dive in.
In case you’re new here, each week we highlight stocks nearing or entering Hot Zones, i.e. key levels on the charts with great risk-reward setups. Stay tuned and subscribe to get these alerts before anyone else!
Check out this week’s hot zones:

In case you want to follow along, we used the following parameters for these alerts:
-Number of bounces: 6
-Minimum bounces: 2
Agilent Technologies Inc (A)
Healthcare • Diagnostics & Research • USA • NYSE

Our scanner picked up A earlier this week, having just ended a three-month-long nosedive.
It had recently bounced off a strong double-bottom support zone, and was attempting to break through another old resistance in its October 2020 zone.
We flagged this as its biggest hurdle on the way toward our upside target of $126-131 (the January 2021 zone).

But for now, the October 2020 resistance is holding strong—it fended off this most recent retest and put a damper on A’s upward push.
What do you think? Is this just a minor setback, or did we speak too soon on that double-bottom support?
View A’s chart and zones here
Ross Stores, Inc. (ROST)
Consumer Cyclical • Apparel Retail • USA • NASD

ROST is a perfect case study in why zones can often be more reliable than traditional support/resistance lines.
When the scanner flagged ROST, it looked as if it had cleanly broken out of the January 2024 zone—with a clear 6% runway to its February 2024 zone above.
But we noted that our zone algo had NOT yet registered this as a legit penetration.

Looks can be deceiving. That “breakout” was a fakeout—and ROST proceeded to slide back down to the bottom of the zone.

It’s currently almost 3% down since the alert.
So what’s next? Is ROST headed back down toward the January 2020 zone, or is it gearing up for another penetration attempt next week?
View ROST’s chart and zones here
Quanta Services, Inc. (PWR)
Industrials • Engineering & Construction • USA • NYSE
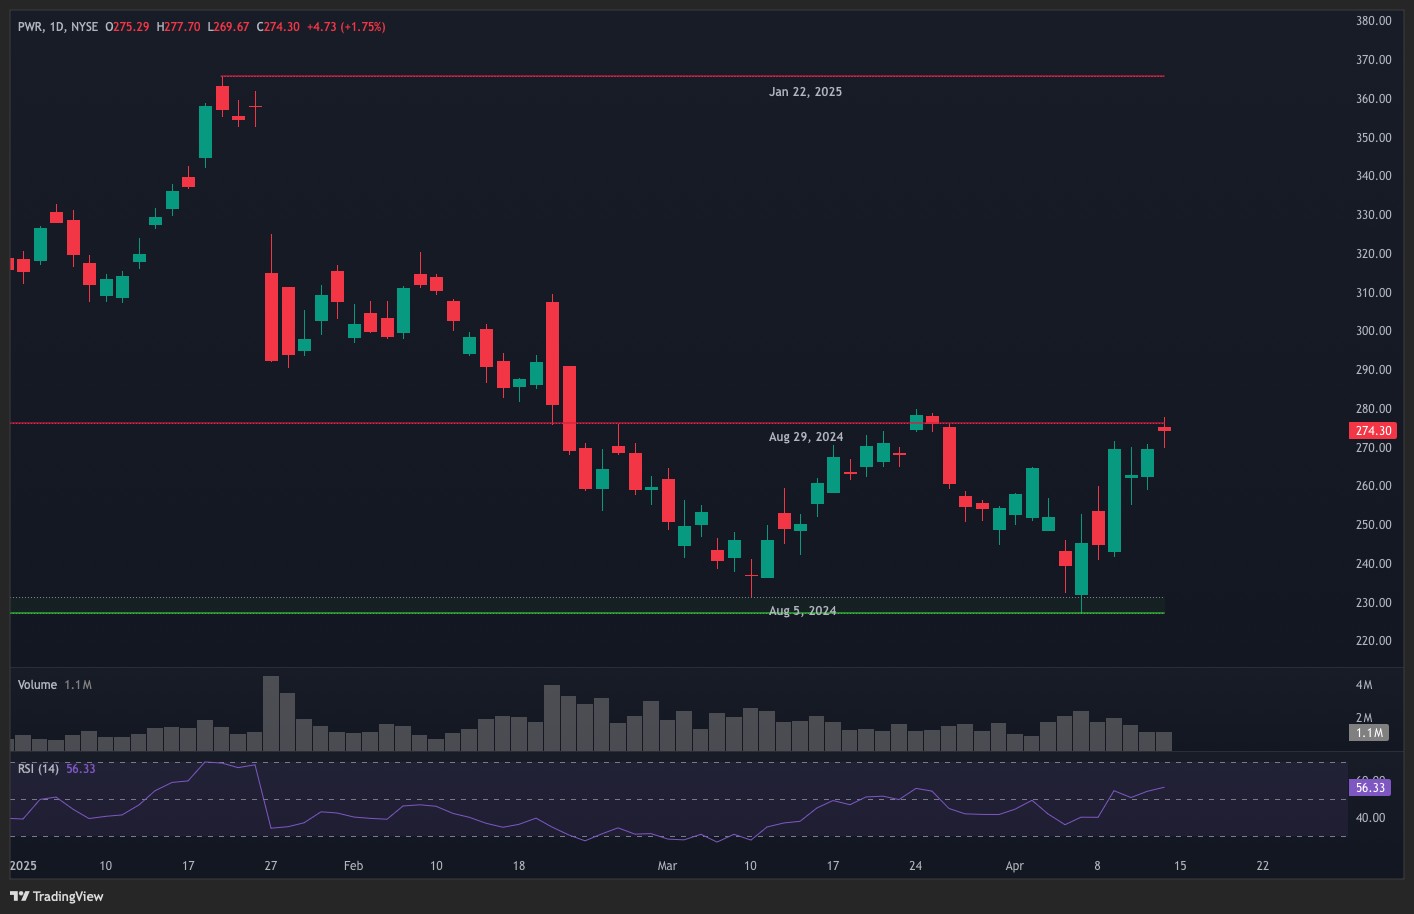
When PWR appeared on our scanner, it was ping-ponging between its August 2024 zones.
It was a channel that has been quite profitable for swing trades since late February, and we thought it had at least another swing left in it.

As with every other setup in this recap, this is still too soon to call… but it’s looking promising so far.
The stock bounced off the August 29 resistance and momentum quickly took a 180. As of yesterday’s close, PWR is down 2.5% from the alert—nothing huge, but a decent start.
And if you look at PWR’s chart, you’ll see that there’s another zone between the August 2024 resistance and support zones—do you think this will factor into our swing setup?
View PWR’s chart and zones here
—
That’s it for today! Back with more zone alerts next Tuesday.
But of course, you wouldn’t need to wait till then. Get personalized Zone Scanner results and real-time Hot Picks when you sign up for the Trading Places platform.
WTF are Zones, anyway?
Zones are key price levels where the market has reacted strongly in the past—such as sharp reversals or sudden swings.
They’re areas where actual supply and demand met in the past, and likely will meet again.
“Why are these significant?”
Well, it all comes down to three key principles. We like to call them The Principles of:
When I Dip, You Dip, We Dip (aka psychology)
Traders are aware that others are watching these levels (zones) too. With everybody paying attention, this creates a self-fulfilling prophecy where everybody acts in anticipation of everybody else’s actions.
Markets Gonna Market ¯\_(ツ)_/¯ (aka technical factors)
If the first price rejection at the top of a zone was violent, it’s likely that buyers who entered at that level are now holding losses.
But with each retest, the rejection weakens, as there are fewer buyers remaining underwater. This weakens that resistance (or support for all you short-sellers), and could eventually lead to a break through.
Killer Whales (aka institutional plays)
Big players need liquidity in order to place massive orders without moving the market against themselves. So they wait for these zones, knowing a lot of us small fry (retail traders) will come to play.
This allows them to buy low or sell high without causing a lot of waves.
But remember: Zones are NOT guarantees but rather regions of increased probability for market moves. So always, ALWAYS use proper risk management.
Trading Places: Launch coming VERY soon!
Stop obsessively refreshing your charts like it’s your ex’s Instagram.
By combining historical patterns with real-time market data, Trading Places identifies zones and assigns probabilities to each one—helping traders spot potential plays with higher chances of success.
It automates all of the curation, chart-plotting, and alerting for you, so you can actually have a life (or at least pretend to)!
Stay tuned!
Disclaimer: This isn't financial advice. This shouldn’t be news to you.